Want to see the shape of your story come to life? A plot diagram (or story plot chart) shows the highs, lows, or turning points of a tale at a glance. It helps you spot how scenes connect, where tension builds, or how different timelines and choices might unfold. Bonus: it’s also great behind-the-scenes content for your readers!
Read on to explore popular plot diagram types, plus how to plan visually with Plottr!
What is ‘the plot diagram’?
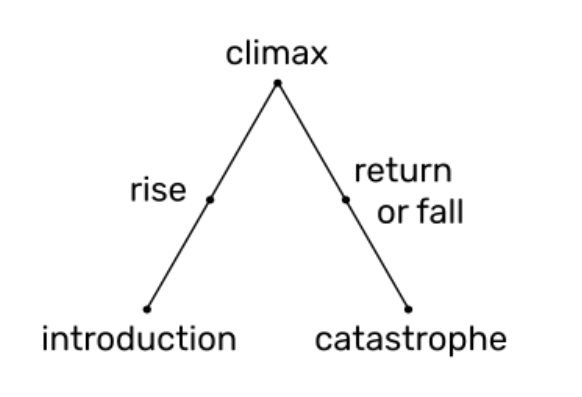
Usually when writers talk about “the plot diagram”, they mean the five stages of a three-act story.
- Exposition or Introduction: The beginning of a story, where an inciting event propels characters to take action (such as departing on a heroic adventure)
- Rising action: Escalating conflict, tension and complication creates gripping suspense and uncertainty
- Climax: A high point of intensity where conflict is at its peak (such as a final showdown with an arch-villain)
- Falling action or return: A reduction in intensity after the climax, such as the voyage homeward (which may also include conflicts of its own)
- Resolution (or Catastrophe): The ultimate resolution of the story’s central ‘problem’ or scenario, or total catastrophe (in the case of a tragic ending that denies resolution)
This plot diagram (also known as Freytag’s Pyramid) is often represented as a simple story plot chart, like this:
Freytag’s Pyramid is only one way to show how a story moves and evolves. Want more ideas? Here are a few other ways to map your plot:
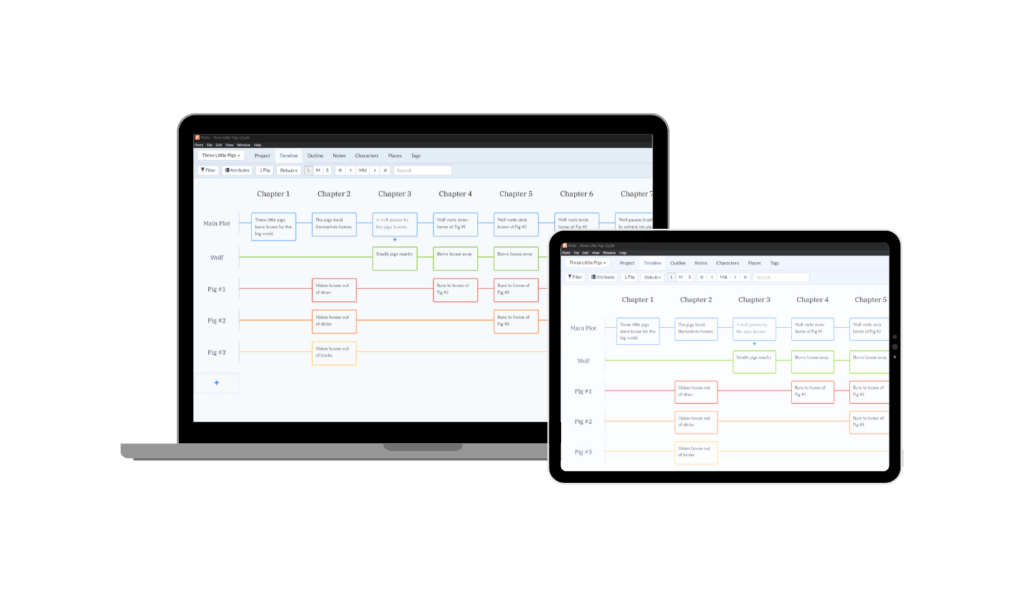
Use Parallel Timelines to Map Plot and Character Arcs
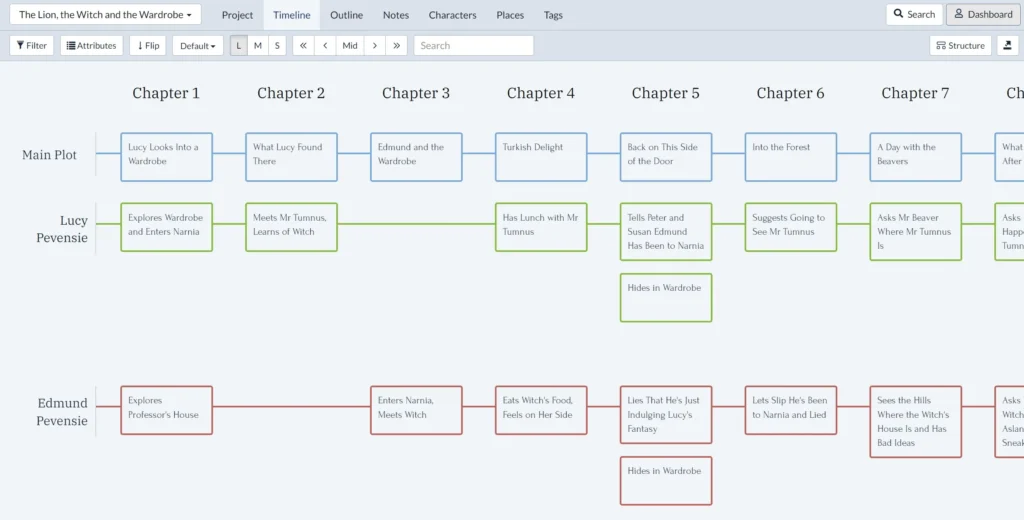
Plottr is great at one kind of plot diagram: visual timelines. But why are timelines so helpful for planning stories?
- Show clear event order. One thing causes another. Timelines help you spot that chain of events so your story flows and makes sense.
- Compare character arcs. When you map each character’s journey, scene by scene or chapter by chapter, it’s easy to see what’s missing or out of sync.
- Reorder events with ease. Vladimir Nabokov used index cards to shuffle scenes until the order felt right. Plottr lets you do the same, but without the mess and paper cuts.
- Use color to track tension. Try giving each scene a color based on tension (low, medium, high). You’ll quickly see where your story slows down or speeds up.
- Test different outcomes. Want to try a twist or a new path for your main character? Make an alternate timeline and explore what could happen at no risk to your main plot.
- Plan episodic or serial fiction. Building a multi-book saga or episodes in a series? Use parallel timelines to lay out each part side by side, like a story bible.
Explore Plottr demos here and see for yourself how Plottr helps authors brainstorm and plan out strong stories.
Graph High and Low Points of Tension with Line Charts
Line charts are an easy way to show how a story rises and falls.
For example, here’s one that maps the tense moments in The Lion, the Witch and the Wardrobe by C.S. Lewis.
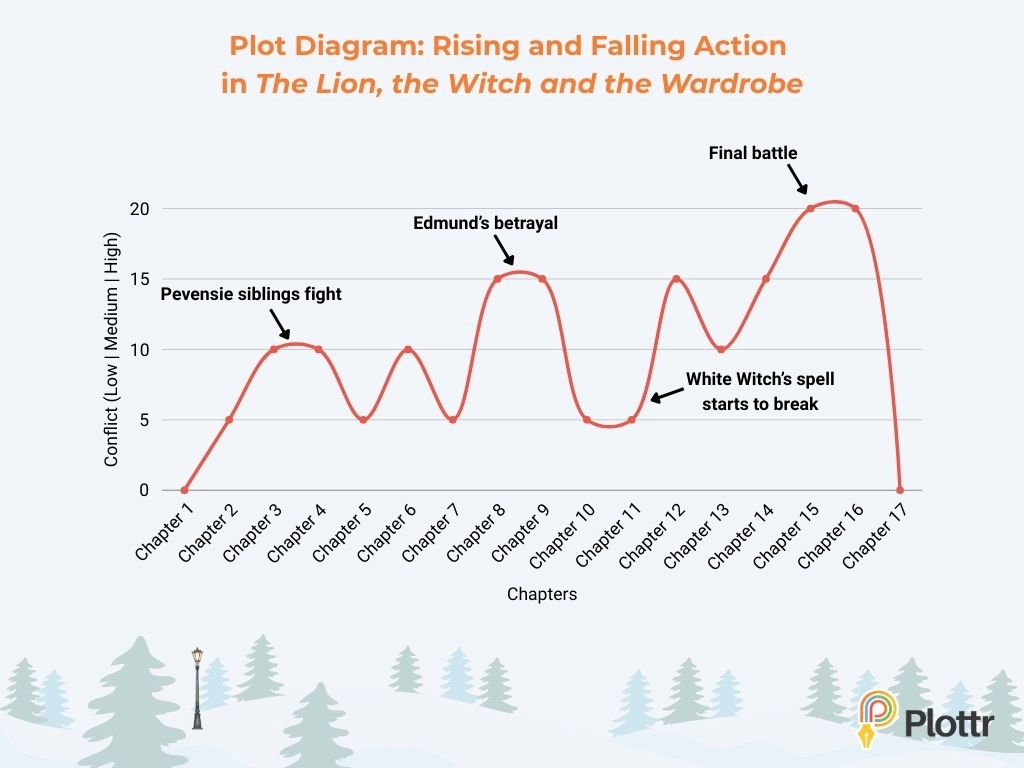
Looking at your outline this way helps you see where tension rises and falls. In this story, there are three key spikes in tension:
- When Lucy discovers Narnia, her siblings don’t believe her and tease her mercilessly. She also finds out early on about the White Witch’s tyranny over Narnia. This creates the first ripples of tension.
- Lucy’s brother Edmund betrays his three siblings, siding with the villain. This creates a higher peak of suspense.
- A final epic battle unfolds between the siblings and the lion Aslan’s forces and those of the White Witch.
A chart like this helps you see where tension builds, where it hits a high point, and where it slows down to give readers a breather.
How to Make Easy Line Charts and Other Plot Diagrams in Canva
You can’t make line charts in Plottr, but there are lots of easy tools that can, like Google Sheets. Canva is one of the simplest. Here’s how to make a plot diagram like the one above:
- Go to Canva’s Line Chart creator and login or sign up.
- Scroll down to Line Charts and click Line (you can also find Line charts under the Charts tab as shown in the image below)
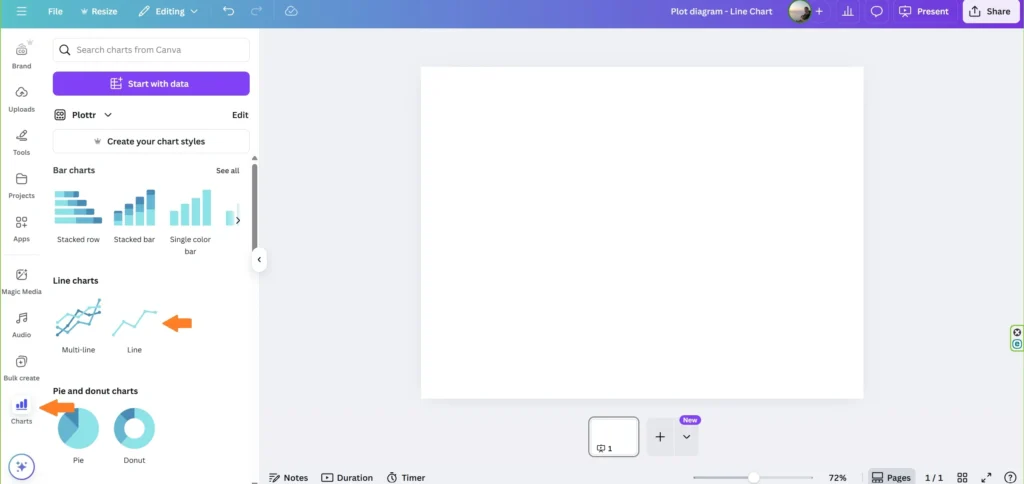
- Double-click the chart that shows up to start editing. In the Data panel on the left, change “Item 1,” “Item 2,” and so on to your story parts (like Chapter 1, Chapter 2).
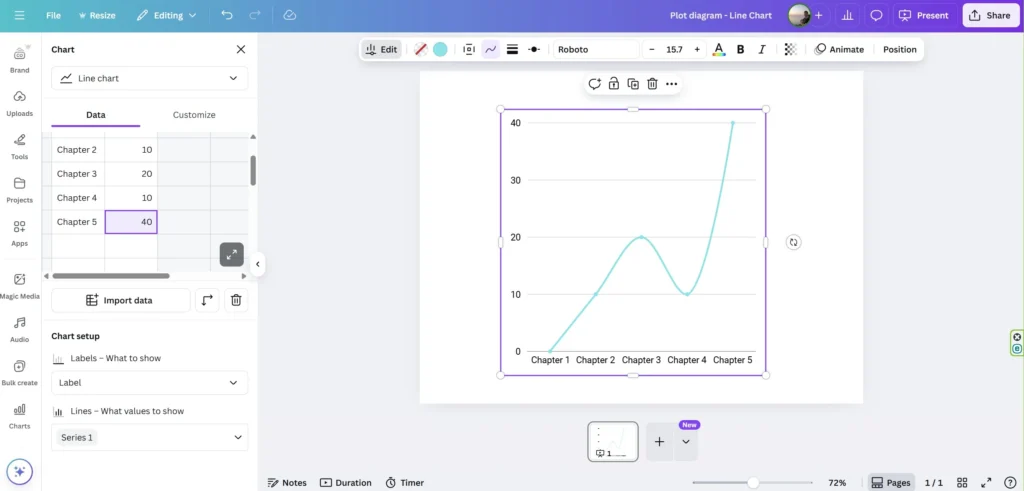
- Pick a scale (like 0 for no tension and 40 for high tension). Then give each story part a number under Series 1.
- In the top menu, you can pick if the line is smooth or straight, change how thick it is, choose the shape and size of each point, and set the color.
Add some design details from the Elements tab and your author branding, and you’re good to go!
More Ways to Diagram Your Plot, Visually
While Freytag’s Pyramid and line charts are popular, they’re just the beginning.
Here are more creative plot diagram types you can experiment with. Remember, you can also add images to Notes in Plottr (a great place to save your story diagrams for future reference).
Use a Donut Chart to Visualize the Story Circle
Dan Harmon’s Story Circle is a simpler form of the Hero’s Journey. Writers often use it for screenplays and stories told in episodes.
It divides the story into eight equal beats:
- You: A character is in a zone of comfort
- Need: But they want something
- Go: They enter an unfamiliar situation
- Search: They adapt to it
- Find: They get what they wanted
- Take: But pay a heavy price
- Return: They return to their familiar world
- Change – Having changed
Try using a donut or pie chart with 8 equal slices to represent each phase.
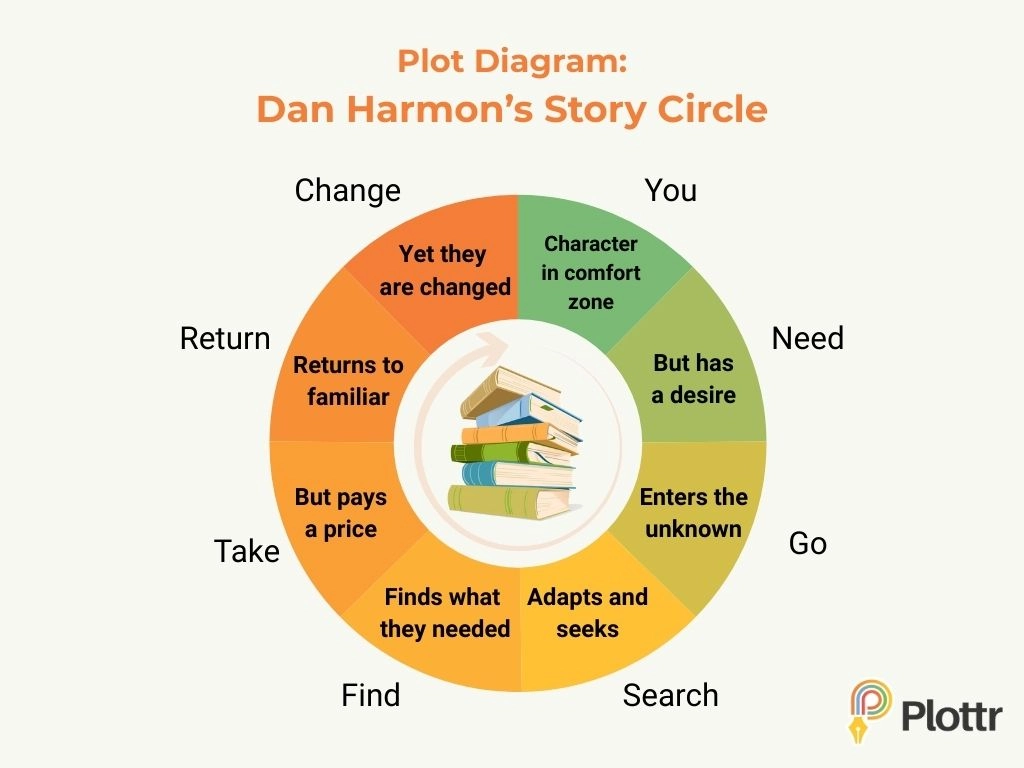
You can even color-code emotional intensity or genre elements (e.g. danger, desire, discovery).
This kind of diagram makes circular structure clear. It’s perfect for recursive stories, theme-heavy narratives, or anything with symmetry.
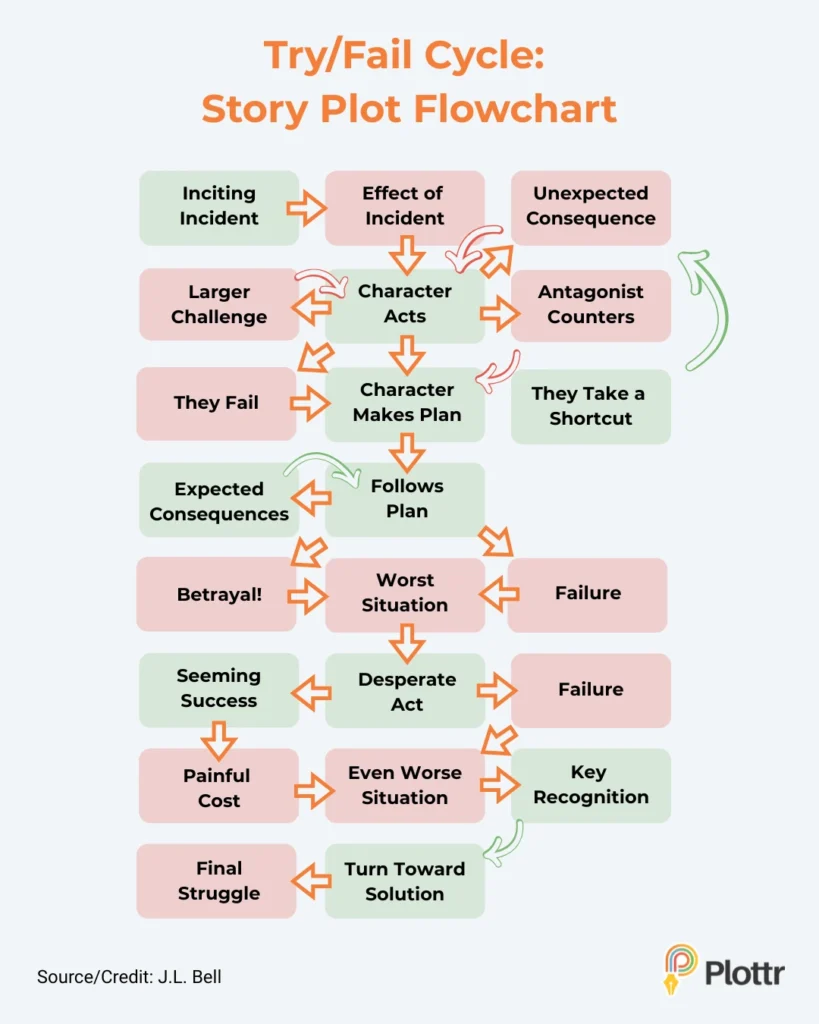
Try a Map-Style Flowchart for Alternate Timelines
If your story has branching paths (like a mystery, RPG-style quest, or choose-your-own-adventure), a flowchart-style diagram can help you:
- Track different decision points and outcomes
- Visualize alternate choices and endings
- Map complex character motivations across plot threads
Here’s a simple and fun flowchart tracking the try/fail cycle for a character. (Credit to J.L. Bell’s original chart, from which this is adapted.)
Some see making diagrams (or any form of plotting) as “yak-shaving”, yet it helps you avoid plot and character development issues later.
See the Whole Picture and Plan with Plottr
We’ve explored using timelines, line graphs, donut graphs and flowcharts to create plot diagrams. Make it even easier with Plottr’s built-in plot, scene and character templates (50+ and counting). Start now with a free 30-day Plottr trial!
How do you use visual storytelling tools and aids? Share your favorite methods below.


2 thoughts on “Creating a Plot Diagram: Visualize Stories for New Perspective”
I would really love to see an iOS version… that works seamlessly with my MacBook… using my own iCloud to sync the two. 😉
Hey Max! Thank you for your feedback. We used to have an iOS mobile version but it was intended more as a companion app and there are challenges involved in working within Apple’s mobile ecosystem for a small team like ours. Currently our dev team’s recommended way to use Plottr on the go is to use app.plottr.com (our browser-based app) with Plottr pro (this includes cloud saves). Thanks for reading our blog!